Friday, 8 October 2010
Stein & DeMuth's Market Signals Go Green Across the Board
Almost a year ago when I reviewed (here) Ben Stein and Phil DeMuth's book Yes, You Can Time the Market, only a couple of indicators / buy signals were green, indicating a good time to buy the S&P 500. Now all four indicators for which they can still get data - Price, P/E Ratio, Dividend Yield and Earnings Yield vs AAA Bonds - are Green. Thought you'd like to know. Let's note that the S&P 500 as I write this is at 1165.47.


Thursday, 7 October 2010
TD Bank Introduces Clever and Beneficial Savings Tool
When a bank launches a good product, it's worth noting and patting them on the back. Part of TD Bank's Get Saving campaign is a clever new tool to help people save. The 1-minute video Tools to help you save explains: each time you make a purchase using your debit card or take money from a cash machine, a pre-set amount (which you set between $0.50 to $5.00 per transaction and can change) is transferred to a savings account. It's the psychological aspect I find most intriguing and promising. First, it's automatic so it's easy. Second, you make the decision to save in advance - people have a much easier time deciding to save more in the future than now. It could actually work!
There is a third aspect, whose effect I could see being good or bad. There is a feedback link to spending - as you spend more, you save more. Will that reduce people's spending by making the money run out sooner or making them think it will, or raise their awareness of how often they are spending? Or will it cause people to think that spending more matters less since they are simultaneously saving more, (with the possible result that they end up being over-drawn - "borrowing to save" would not be good!)?
As an enhancement, TD could offer a pre-set percentage transfer e.g. 1 up to 10% (the latter is an often-recommended amount one should be saving out of income for retirement). That way, people would especially think about bigger purchases and they would save a lot more.
There is a third aspect, whose effect I could see being good or bad. There is a feedback link to spending - as you spend more, you save more. Will that reduce people's spending by making the money run out sooner or making them think it will, or raise their awareness of how often they are spending? Or will it cause people to think that spending more matters less since they are simultaneously saving more, (with the possible result that they end up being over-drawn - "borrowing to save" would not be good!)?
As an enhancement, TD could offer a pre-set percentage transfer e.g. 1 up to 10% (the latter is an often-recommended amount one should be saving out of income for retirement). That way, people would especially think about bigger purchases and they would save a lot more.
Wednesday, 6 October 2010
Credit Suisse on Inflation - How It Happens, What to Do
Credit Suisse's Global Investor 1.10 report has a lot of worthwhile content on inflation:

- How Inflation Comes About, a one-page Sim City like picture that shows how the financial system and key bits of the economy interact to create the beast we abhor - from Central banks, through commercial banks, the labour market, the capital market, the goods market. Brilliant communication! There's even a helicopter hovering over the stylized city - a sly reference to Helicopter Ben?
- an assessment of Inflation as the escape route for high-debt countries - they say it is "unlikely" because many countries have "... experienced the painful consequences and destabilizing effects of runaway inflation," and won't want to experience it again; but it's much more likely in emerging market countries and commodity exporters and those least affected by the real estate crisis ... hmmm, sounds a fair bit like Canada
- a sidebar on who is best at inflation forecasting - surprise, it is not that implied by subtracting the yield on real return bonds from the nominal return of government bonds - they were the least reliable! Best at the one-year ahead inflation forecasts were ... drum roll ... the central banks. Note how they all slightly under-estimate actual inflation. Based on the expectations on this Bank of Canada page, which does NOT seem to include a forecast by the Bank itself, 2011 looks like it will be in the 2.5-3% range in Canada.

- an inflation history graph going back to 1500 - inflation was a lot lower and more stable between 1800 and 1900!
- people almost always feel inflation is worse than the official CPI numbers say. Most people are not inflation-conspiracy believers, they simply notice and feel the pain a lot more on the purchases they rely on most. It's a new area of behavioural finance, an extension of the "you feel losses twice as much as gains" idea. Hmmm, maybe that's why I think life is cheap here in the UK compared to Canada because wine is definitely a lot less expensive (lots of good table wine at the equivalent of $6.50 per bottle)
- asset inflation caused by lax monetary policy and boosted by leveraging is very dangerous - no kidding - but take away the leveraging, as in the tech bubble, and the lasting real economy effects are not nearly as bad
- an Adjusting to Inflation article shows different asset classes performed differently in different high-inflation periods . In the 1970s, gold, oil and commodities did best, but between 1986 and 1990 commodities did really well, oil was ok but very up and down and gold did very poorly, much worse than CPI. They then go on with the table below to identify which kinds of assets they think will do well in different economic environments. Their conclusion is one with which I cannot but agree - since you cannot know exactly when and in what form inflation will arise, the best investment strategy is to maintain a balanced diversified portfolio but to be sure to include things like gold, commodities, real return bonds and other hard assets.

- there are personal accounts from three individuals who have lived through either hyper-inflation (Zimbabwe and Argentina), or deflation (Japan) - a strong reminder that we do not want to go there, diversified portfolio or not.

Friday, 1 October 2010
Cap-Weight vs Fundamental Portfolios: Q3 Update, Guess Who Leads
Regular readers may recall that a few months ago I started a contest to see whether a portfolio based on Fundamentally-weighted ETFs would do better than the traditional standard Cap-weighted index ETFs. This contest is meant to be as realistic as possible using actual funds, including trading commissions, currency effects, distributions, DRIPs etc.
The quarterly distributions have all been announced, though not all received as BMO only pays out on October 7th and Claymore on the 6th (so their DRIP calculation will have to wait till then).
However, the quarter end was yesterday so it's opportune to take a snapshot look at how the contest is going (in order to do the comparison I've assumed a bit precociously that the dividends owing by BMO and Claymore are in the cash account now until the DRIP happens, which skews the numbers by $111 in favour of the Fundamental portfolio). With or without that cash, the two portfolios are neck and neck - with the cash, the Fundamental leads and without it, Cap-weight would be ahead. It is less than $100 difference in total either way, or less than 0.1% of the $100,000+ portfolios.
Other observations:
The contest continues ...
The quarterly distributions have all been announced, though not all received as BMO only pays out on October 7th and Claymore on the 6th (so their DRIP calculation will have to wait till then).
However, the quarter end was yesterday so it's opportune to take a snapshot look at how the contest is going (in order to do the comparison I've assumed a bit precociously that the dividends owing by BMO and Claymore are in the cash account now until the DRIP happens, which skews the numbers by $111 in favour of the Fundamental portfolio). With or without that cash, the two portfolios are neck and neck - with the cash, the Fundamental leads and without it, Cap-weight would be ahead. It is less than $100 difference in total either way, or less than 0.1% of the $100,000+ portfolios.
Other observations:
- Strong portfolio gains: both portfolios up almost 10% since June!
- Correlated asset classes can be good: every single ETF / asset class in both portfolios has gone up since June. That's highly unusual and sure not to continue for very long. The value of having a diversified portfolio is still evident in the large disparity between the gains amongst the ETFs. If one had only been invested in Canadian large cap equity with a 4% gain and bonds with a 2% gain, the overall portfolio gain would have been somewhere in that low range. Emerging markets, Developed markets ex-US, international real estate, commodities and Canadian small cap and REITs all contributed percentage advances of triple or more Canadian large cap's. Another way to look at it is that not having a diversified portfolio means having to pick which asset class will go on a tear next in order to get good gains. Diversification = not as good as the best but better than the worst.
- Fundamental winning in most asset classes vs Cap-weight - leading by 5 to 2. It is still early days in our contest but this is going in the direction I would expect. ... However, where Cap-weight is winning (Canada large equity and Emerging markets equity), it is by enough to more or less balance things at the portfolio total. As I wrote about here, in the Canada equity case, I believe the difference is due to the ongoing Potash Corp takeover bid.
- No re-balancing required: in neither portfolio is the actual value of any asset class anywhere near to going beyond the 1/4 away from target that we said would be our rule for re-balancing; the Cap-weight percentages are slightly more out of whack compared to target, which is what we would expect from indices that rely on market prices - fundamental accounting weights should evolve more slowly. That will be interesting to watch as we go along. (in the updated spreadsheet that appears live at the bottom of this blog, I've inserted a new column in the individual portfolio spreadsheets that shows the ratio of each asset class' actual to target)
- Currency has reduced returns: the Canadian dollar has risen about 1.4% vs the USD since our launch, reducing our net returns on US denominated holdings and that is the same for both portfolios.
The contest continues ...
Wednesday, 29 September 2010
EDHEC Papers Burst Balloons on Cap-Weighted Indexing and SRI Funds
The EDHEC-Risk Institute, an academic institute with a practical orientation, has put out a couple of papers that knock down some investment wishful thinking.
In Does Finance Theory Make the Case for Capitalisation-Weighted Indexing?, authors Felix Goltz and Véronique Le Sourd, after reviewing the academic literature, answer that question quite categorically - "No, it does not". A cap-weighted index does not represent the market portfolio of finance theory and even if it could, it would not be efficient in a risk-return sense without making highly unrealistic assumptions. As they say, "... from a theoretical perspective, cap-weighted stock market indices seem to offer no particular advantage". It then becomes a practical problem to construct indices that offer higher return to risk trade-off (as expressed in higher Sharpe ratios). They offer their own Efficient Indices here and when they assess alternatives (Improved Beta? A Comparison of Index Weighting Schemes) like fundamental indexing, equal weight indexing, efficient indexing and minimum volatility indexing, the alternatives all beat Cap-Weighting (e.g. their US Efficient Index has outperformed the FTSE US Cap-weighted index by 2% annually since 2002 while lowering volatility). Of course, not all these better indices are investable for the average retail investor - so far only fundamental and equal-weight funds are available - and the costs of running the index fund could obviate the benefits (witness the sorry story of mutual funds in Canada) if too high (my assessment of US ETFs suggests they do preserve the benefit in real life and I've started a realistic portfolio experiment for a Canadian investor that includes Canadian ETFs).
The other foray into clarifying reality vs wishful thinking is The Performance of Socially Responsible Investment and Sustainable Development in France: An Update after the Financial Crisis by Noël Amenc and Véronique Le Sourd (again! does she like setting people straight or what?). Comparing the performance of SRI funds in France, they cannot really find any significant difference with ordinary funds in terms of risk-return efficiency. During the period of the financial crisis, SRI funds provided no better protection against the downturn. A subset of SRI, Green (environmental) funds, compared to best-in-class ordinary funds "... reveals, over the long term, higher alpha for green funds, with higher risks, including higher extreme risks." The paper's findings will give some comfort to the SRI-minded investor with its evidence that the investor need not lose out by going SRI. However, it does also remind us that SRI is no investing philosophy panacea either. I am currently reading Confessions of a Radical Industrialist by Ray Anderson and he leaves an over-the-top impression that going green is a sure-fire route to greater profitability. That may be so if you do it right but I daresay there are well run and badly run SRI and green companies, just as in any human activity (as an illustration of the principle for those with a reflective bent, I highly recommend the book Albert Speer: His Battle With Truth by Gita Sereny; it tells the story of a highly intelligent but amoral organizational genius who put his talents in the service of evil as the mastermind of Hitler's war production machine)
In Does Finance Theory Make the Case for Capitalisation-Weighted Indexing?, authors Felix Goltz and Véronique Le Sourd, after reviewing the academic literature, answer that question quite categorically - "No, it does not". A cap-weighted index does not represent the market portfolio of finance theory and even if it could, it would not be efficient in a risk-return sense without making highly unrealistic assumptions. As they say, "... from a theoretical perspective, cap-weighted stock market indices seem to offer no particular advantage". It then becomes a practical problem to construct indices that offer higher return to risk trade-off (as expressed in higher Sharpe ratios). They offer their own Efficient Indices here and when they assess alternatives (Improved Beta? A Comparison of Index Weighting Schemes) like fundamental indexing, equal weight indexing, efficient indexing and minimum volatility indexing, the alternatives all beat Cap-Weighting (e.g. their US Efficient Index has outperformed the FTSE US Cap-weighted index by 2% annually since 2002 while lowering volatility). Of course, not all these better indices are investable for the average retail investor - so far only fundamental and equal-weight funds are available - and the costs of running the index fund could obviate the benefits (witness the sorry story of mutual funds in Canada) if too high (my assessment of US ETFs suggests they do preserve the benefit in real life and I've started a realistic portfolio experiment for a Canadian investor that includes Canadian ETFs).
The other foray into clarifying reality vs wishful thinking is The Performance of Socially Responsible Investment and Sustainable Development in France: An Update after the Financial Crisis by Noël Amenc and Véronique Le Sourd (again! does she like setting people straight or what?). Comparing the performance of SRI funds in France, they cannot really find any significant difference with ordinary funds in terms of risk-return efficiency. During the period of the financial crisis, SRI funds provided no better protection against the downturn. A subset of SRI, Green (environmental) funds, compared to best-in-class ordinary funds "... reveals, over the long term, higher alpha for green funds, with higher risks, including higher extreme risks." The paper's findings will give some comfort to the SRI-minded investor with its evidence that the investor need not lose out by going SRI. However, it does also remind us that SRI is no investing philosophy panacea either. I am currently reading Confessions of a Radical Industrialist by Ray Anderson and he leaves an over-the-top impression that going green is a sure-fire route to greater profitability. That may be so if you do it right but I daresay there are well run and badly run SRI and green companies, just as in any human activity (as an illustration of the principle for those with a reflective bent, I highly recommend the book Albert Speer: His Battle With Truth by Gita Sereny; it tells the story of a highly intelligent but amoral organizational genius who put his talents in the service of evil as the mastermind of Hitler's war production machine)
Saturday, 25 September 2010
Index Investing Becoming a Victim of Its Own Success
Too much of a good thing can end up being bad. That includes using a benchmark index as the basis for an investing apparently.
In the July 2010 paper (download here from SSRN; acknowledgement to Stingy Investor where I found the link) On the Economic Costs of Index-Linked Investing, NYU prof and NBER research associate Jeffrey Wurgler reviews some research results that are disquieting for investors who follow a passive index strategy based on popular indices such as the S&P 500.
Wurgler says: "... the increasing popularity of index-linked investing may well be reducing its ability to deliver its advertised benefits ..." The problems:
What does he suggest one do about it?
In the July 2010 paper (download here from SSRN; acknowledgement to Stingy Investor where I found the link) On the Economic Costs of Index-Linked Investing, NYU prof and NBER research associate Jeffrey Wurgler reviews some research results that are disquieting for investors who follow a passive index strategy based on popular indices such as the S&P 500.
Wurgler says: "... the increasing popularity of index-linked investing may well be reducing its ability to deliver its advertised benefits ..." The problems:
- the inclusion of stocks in the index pushes up prices, by around 9% around the time of the event, a factor that has been getting worse as indexing has gained popularity; this effect is observed for other indices besides the S&P 500, like the TSX 300 (now the delicately named TSX Composite, which hides the fact the fact that it has been shrinking steadily in number of stocks over the years to 235 today)
- active managers who are benchmarked against the index have an incentive to overweight index members, even if they think a non-index stock will appreciate the same percentage, due to lesser tracking error
- stocks that join a leading index such as the S&P 500 suddenly begin to move much in tandem and keep doing so, which Wurgler vividly likens to the movements of a school of fish; he calls this effect "detachment"
- the S&P 500 school of fish members moves on their own and less like the overall market, a net loss of diversification for the investor
- S&P 500 membership has in the past over the long period of 1980 to 2005 conferred an increasing price premium; he cites one study that found the S&P 500 stocks got an 82 basis point annual alpha return premium; while it might seem like a good thing to get a hefty excess return, he says it might be a sign of an "indexing bubble" that will sooner or later deflate
- as a consequence, bubbles and crashes are more likely; he discusses the mechanism that may explain both the 1987 crash and the May 2010 flash crash
- the risk and return relationship actually does not hold - low beta(risk) stocks have been found to generate better returns, by a lot, than high beta stocks, a phenomenon he rightly calls a spectacular anomaly; he explains how fund managers benchmarked to an index will favour high beta stocks
- he raises the possibility that the S&P cap-weighted index amounts to a strategy of large-cap growth and momentum ... "Clearly, the line between passive and active investment is blurrier than usually presented."
What does he suggest one do about it?
- instead of the S&P 500, pick a broader index like the Wilshire 5000 - "The S&P 500 Index's detachment means, however, that it is reflecting less and less the performance of the full stock market. Index funds based on the more comprehensive Wilshire 5000 (which has included as many as 7,200 stocks) are now providing more robust diversification and stock market exposure."
- exploit the observed "spectacular anomaly" through strategies that focus on low-beta stocks, e.g. employ maximum Sharpe ratio, minimum volatility and absolute returns, though I'd guess that is probably beyond most individual investors' capability
Thursday, 23 September 2010
WaterFurnace Renewable Energy (TSX: WFI) - a Buy for all the right reasons
WaterFurnace Renewable Energy (TSX: WFI) is a very unusual company - unlike every other trendy "do good for the environment" stock, it is highly profitable and its stock is, I believe, much undervalued. Here's why.
Geothermal Heat PumpsWFI makes geothermal heat pumps. Wikipedia article describes history, principles that underlie the technology, how the technology works, economics. WFI's former president Bruce Ritchie explains in this video how it works and why it is so worthwhile.
Industry Prospects
Presentation by LSB Industries at Canaccord Genuity Conference 10th August 2010
Geothermal Maturity


Market Growth:


Competition
WaterFurnace the Company and the Stock
Visibility: Not Just Under the Radar, It's Well Below Ground
Last, and perhaps not least for many people, WFI is providing a nuts and bolts, highly effective energy solution that helps both consumers in a direct financial sense and the environment by reducing the need for non-renewable fuel. What's not to like about this company?
Disclosure: I now own some shares in WFI. I know, I know, it's not in keeping with my passive index fund investing strategy but after my best shot at due diligence, including especially establishing a value, I think it's worth an exception.
Disclaimer: This post is my opinion only as to how and why I came to my own investment decision. Whether you agree or not, it should not be taken as investment advice.
Geothermal Heat PumpsWFI makes geothermal heat pumps. Wikipedia article describes history, principles that underlie the technology, how the technology works, economics. WFI's former president Bruce Ritchie explains in this video how it works and why it is so worthwhile.
Industry Prospects
Presentation by LSB Industries at Canaccord Genuity Conference 10th August 2010
Geothermal Maturity
- technology for energy known for many years, proven efficiency benefits; manufacturer equipment still improving but fairly close in technical capability - key differentiator for install success is contractor installer skill and diligence
- dealer networks in place, extension of capability for contractors
- consumer knowledge in North America in its infancy but the information/hype infrastructure is in place - industry associations (GeoExchange in USA, Canadian GeoExchange Coalition), web sites and consumer forums (GreenBuilding Talk)
- residential easiest and cheapest for new-build but still attractive for retrofit, esp. at furnace or air con replacement moment; WatwerFurnace claims present 100k annual install rate could rise to 1 million p.a. by 2016
- attraction is fuel bill savings, appreciable now and probably greater in future if commercial aka power company prices rise
- government tax breaks and write-offs are an incentive
- substantial up-front cost creates affordability challenge, especially at a time when home values are dropping, credit is tight and consumers are trying to reduce debt, not take on more
- lack of knowledge and solution visibility and trust not quite there - are we close to a tipping point?


Market Growth:
- stalled during housing crash in USA - housing starts down to 500k annually but WaterFurnace expecting (Q2 earnings call) return to 1.2 -1.5 million p.a. by c. 2012
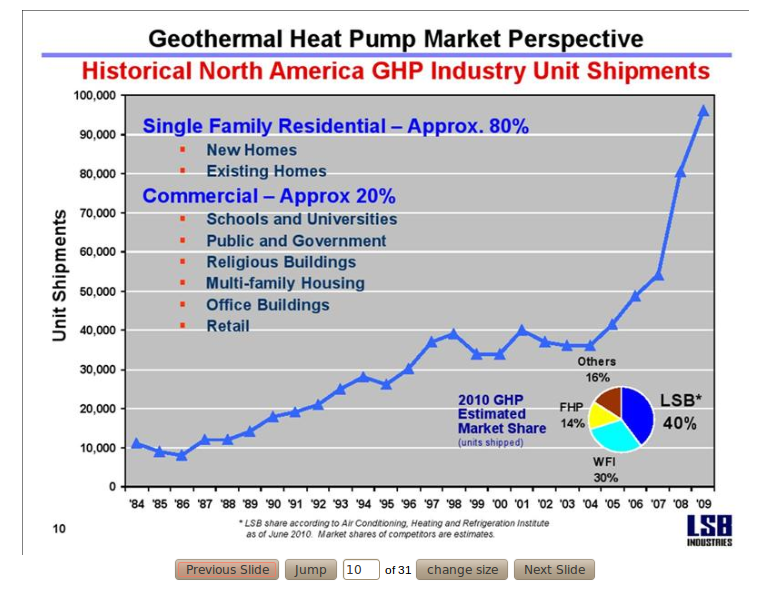

Competition
- main competitor is LSB Industries (NYSE: LXU), which has about twice the $ sales of WFI in climate control, though the manufacturing figures of the US Energy Information Administration for 2008 has them about equal in shipments (WFI = Indiana, LXU = Oklahoma); WFI has gained market share in 2010, as it claims in its 2Q Report - its sales rose 13% in the first six months of 2010 while LXU's fell 11%;
- biggest other competition - Trane (owner Ingersoll Rand), Florida Heat Pump (owner Bosch), McQuay (owner Daikin of Japan), Mammoth (private company)
- October release of shipment figures by the US EIA will show evolution of market share through 2009
WaterFurnace the Company and the Stock
Visibility: Not Just Under the Radar, It's Well Below Ground
- Low trading volume - 11,000 average but in recent months even lower; trades are in small amounts, 1 or 2 board lots at a time, indicating retail investors, not institutional investors are the market
- Google Finance does not even track price now - trading volumes too low?
- Only two analysts cover it
- Only a few Globe and Mail stories - mostly in stock screens results for desirable traits
- US interest low - likely because it is a US company traded in Canada on TSX
- not listed in StockChase, no chat board on Raging Bull etc
- no search results on book website for Clean Tech Revolution, nor is it mentioned in the book; not in book Investing in Renewable Energy nor is it in a search of that book's website Green Chip Stocks
- boring - uggh, they make HVAC equipment; ughh, stock price hasn't budged in four years; also likely means that "momentum" traders are staying away, so we shouldn't expect big leaps and swings; boring is good
- Cormark Securities has a full stock investment assessment on Power and Alternative Energy Companies that includes WaterFurnace; 12 mth price target is C$31 based on historical average P/E and projected EPS in 2011
- warranty costs - WFI mgmt assumes constant failure rate according to historical experience; has a long enough track record to assess the 10 year warranty it offers but new products may not do as well (any ISO quality control for manufacturing or by its chosen supplier partners?)
- margin pressure due to
- material costs, esp copper tubing, rising faster than price increase can compensate, together with
- competitors, who are in most cases, as Company docs say, larger and can source raw materials cheaper; 2Q earnings call mentioned drive to expand market share as successful but at cost of lower margins; same call mentions that it has taken steps to improve efficiency (outsource some manuf to 3rd parties?) which it expects will pay off in 2011
- government incentive programs - tax breaks or grants reduce hefty upfront cost and shorten consumer payback; US govt on board to 2016 and Canadian government on fence (Canada is 15% of sales now) but likely to start replacement for cancelled ecoEnergy program
- foreign exchange - WFI operates in USD, including dividends to Canadians (though those are 100% eligible dividends for income tax reports); as CAD rises relative to USD that's bad for Canadian investor
- no sales only purchases within last year by both mgmt & directors; very quiet
- outstanding - ROE > 50% with no leverage at all (no long term debt at all)!; ROA close to 50%; operating margin 15+%, net margin 11+%; this is on level with the best of the best on the TSX (see this Sept.5 GlobeInvestor screen by Simon Avery for high ROE in large TSX stocks - only the TMX Group is up there with WFI); by comparison, a main competitor LSB Industries (NYSE: LXU) has ratios less than half as good and a large amount of debt (Debt/Equity = 0.7 in 2009)
- gross margins did fall 4% in 2Q10 (Aug.5) but mgmt stated in conf call they expect better in 2011
- absence of debt removes financial leverage effect > earnings & ROE will be much more stable i.e. risk is reduced
- inventories, receivables very stable
- 2Q2010 Earnings Call Podcast from Newswire.ca
- founding Shields family still owns about 25% of company shares, but in laudable and unusual fashion, has not created non- or restricted-voting share class
- managers and directors have significant stake in form of actual shares; no stock options outstanding as of Aug.5 > no temptation for accounting shenanigans
- WFI's competitors are in several cases owned by large corporations - some may want to "round out" their portfolio with a company that is a close second in market share, especially if market seems to be taking off and there is potential for massive sales increases
- WFI capital structure could easily take on some some debt since it has none at the moment - a big corp with debt could apply its own financial leverage to increase ROE even more since ROA at 50% is way above current borrowing costs
- big corp might have tax credits available from losses to shield income of WFI
- much as it is nice to receive dividends, WFI's dividend policy makes no sense - it should be paying zero dividends - if it can reinvest earnings at ROE 50+%
- big corp could apply its purchasing power to reduce material costs (WFI mentions this factor as an advantage its larger competitors have) and increase margins
- WFI's stock price is low compared to its reasonable value even under its present structure & operations
- due to very low trading volume, WFI stock price entails an illiquidity price penalty (as manifested in high bid-ask spread), probably quite substantial (10%?); a good part of the reason I believe is that it is a US company trading on the TSX
- minimum $29, using very conservative assumptions of - zero growth for the next two years, followed by a ten year period of 15% annual growth in earnings and dividends then a steady state of 5% annual growth thereafter, combined with a high market risk premium of 8% (over the risk free rate of 2%; one consideration was future likely available rates of return per this previous post); assumption of no growth based on the US housing market staying flat and housing starts not recovering for another two years, since that is the key to WFI's growth; assumption of 15% growth based on very limited penetration of geothermal and its compelling economic advantages to property owners, both residential and commercial, and the vast potential market, combined with the fact that WFI's annual growth in the period before the 2008 housing and market crash ranged from 15 to 60%; assumption of 5% constant growth thereafter accounts for most of the eventual total discounted cash flow value of WFI and is at the low end of historic corporate returns;
- assumption of 1.1 beta, not actually calculated in strict terms as the covariance with market return, implies higher volatility than the overall TSX, though one might wonder comparing the price chart of the two (along with LXU, WFI's main competitor) on Yahoo Finance; if beta is only 1, same as the market, the value of of WFI goes up a lot - to $62 for the optimistic assumptions and $34 under the conservative assumptions; the absence of any leverage / debt in WFI reduces operating and financial risk of WFI, stabilising earnings, and is a reason to think its market volatility should be less; reading through WFI's financial statements, one gets a feeling of squeaky clean and no nasty surprises in the offing (e.g. there has never been a big write-off of one-time charges, there are no off balance sheet obligations), which lessens the chances of downward price spikes

- up to $50 using reasonable but not outlandish assumptions - 2% growth for two years, in line with expected inflation, 20% for ten years, in line with resumption of a housing market back up to about 1 million US housing starts, up from half that today, along with normal credit conditions and 6% constant growth steady state afterwards
- growth is the key to WFI's value - the current earnings justify a stock price of $10 (12% discount rate) to $15 (8% discount rate); one to think this stock is worth more, one has to believe that geothermal is a coming thing and that WFI will be along for a very profitable ride
- working backwards from the implications of the current market price of around $25.50, the growth rates in WFI's earnings and dividends are modest (6 to 6.5%) even with high required rates of return of 10%; this looks quite achievable for this company
- the model I've used is the dividend discount model in three stages ( go to McGraw Hill's Investments textbook website to download the spreadsheet here)
- my assumptions, values tested and a look at the model

- WFI is currently trading a narrow band bouncing up and down daily from $25 to $26; if it continues to do so, the 3.5% dividend return provides some return


Last, and perhaps not least for many people, WFI is providing a nuts and bolts, highly effective energy solution that helps both consumers in a direct financial sense and the environment by reducing the need for non-renewable fuel. What's not to like about this company?
Disclosure: I now own some shares in WFI. I know, I know, it's not in keeping with my passive index fund investing strategy but after my best shot at due diligence, including especially establishing a value, I think it's worth an exception.
Disclaimer: This post is my opinion only as to how and why I came to my own investment decision. Whether you agree or not, it should not be taken as investment advice.
Subscribe to:
Posts (Atom)


 Stumble It!