Saturday, 2 June 2012

Book Review: Purple Chips by John Schwinghamer

Purple chips is author Schwinghamer's invented term to describe the best of the blue chip stocks. In his definition found on the book's website, purple chips are large companies with a market cap minimum of $1 billion which have an unblemished track record of seven years growing earnings per share (EPS).

The book lays out Schwinghamer's method for long term trading in the purple chips, i.e. his method for picking when to buy and when to sell. The method is designed, in his analogy, to hit singles and doubles, not to try for the home run. The method appeals to common sense since it is based on two factors - first, the idea that in the long term the stock price is determined by EPS (what Warren Buffett said thusly: "If a business does well, the stock eventually follows"); second, the fact that markets go through periods of optimism when investors are willing to pay more for earnings (reflected by rising P/E multiples across the board), or the opposite pessimism. For a particular stock there may also be company-specific good or bad news that causes the market's willingness to pay more or less for earnings, which he calls valuation resets. He thus establishes a reasonable trading range for any purple stock. The signal to buy is when the price goes above the upper bound and to sell below the lower bound. All this is summarized graphically on a chart which overlays EPS and stock price, such as the image below taken from the book.

That is the gist of his method, though there are more rules, which he explains, to fine tune the buying and selling decisions as well as for building a portfolio of such stocks (such as not exceeding 15% invested in any sector, or 3% in a non-dividend paying stock). Schwinghamer's system is unique but he takes the trouble to show how its conclusions about stock value are the same as a traditional fundamental financial and ratio analysis would come up with.

Schwinghamer's book is graced with clear direct informal writing including helpful analogies, with progressive and well-organized exposition from a very low assumed knowledge base to the somewhat intricate level of his unique system and with numerous charts and real stock examples (a whole chapter is devoted to several case studies that walk through valuation resets and buy/sell decisions, as well as profits thereby attained).

Though the method is clear, I believe there are a few big challenges for an individual investor wanting to try applying it:
  • extreme discipline and patience, which he admits himself might be the toughest task, since it may be necessary to wait for years before the price of a stock becomes favorable (e.g. in his Abbott Labs case study); part of the challenge is to constantly track quarterly results for all the candidate stocks and market moves
  • data availability and manipulation - he uses his Bloomberg professional terminal to quickly pull up and chart the trailing 12-month EPS for seven years against stock price; try to do that with Yahoo Finance, Google Finance, ADVFN, GlobeInvestor, your discount broker's version of stock research tools, or any other free online website.
The actual mechanics of the method are a bit complicated and subject to some judgement, especially the business of valuation resets and setting the exact location of the high-low price points. The author's explanation in an email response to my query was "The placement of the projected EPS line does influence the buy/sell targets. Keep in mind that this methodology has two objectives: 1) to lead you to invest in companies that have great earnings profiles and 2) to give you a high probability of buying low and selling high." i.e. it is approximate, not exact. Schwinghamer also warns that his method does not pretend to guarantee profitable trading every time on every stock. It is meant to work on average over multiple stocks and trades. Probably it would become easier after some time working with the method.

Those who might be interested in the method but are looking for an easy way to follow it can check the book's website where the Top Picks tab shows both the top 25 US and top 10 Canadian picks with current High or Low price assessment. With free membership registration, all 233 US and 41 Canadian Purple Chips are available.

The method is intriguing and makes a lot of sense and the book does a fine job explaining the method. Any investor considering buying individual company stocks, and especially those who believe in fundamental analysis, can benefit from reading the book and checking out the stocks named in the website. As I discovered on my other blog looking at the stocks in the Purple Chip list, there is considerable overlap with holdings in low volatility ETFs and a fair degree of overlap with stocks arising from various methods that seek out worthwhile companies.

My rating: Excellent book, 4 out of 5 stars.

Monday, 14 May 2012

Swapping in the Invesco PowerShares Canadian Fundamental Equity ETF

For the last few years, the iShares Canadian Fundamental Index Fund (TSX symbol: CRQ) has been my core Canadian equity holding. It is also the ETF used in the portfolio contest at the bottom of this blog, which pits the Fundamental indexing approach against the traditional cap-weighted index approach. Just as as I replaced some time ago the cap-weighted fund XIU with a lower cost equivalent ETF HXT, now it is time to replace CRQ with a new lower fee ETF.

The new CRQ-equivalent was launched with too-little (since I missed it at the time) fanfare in January (press release here) by the Canadian arm of Invesco PowerShares, which offers a number of similar RAFI funds in the USA, such as PRF, PRFZ, PDN, PXH and PXF. The new Canadian equity ETF is the PowerShares FTSE RAFI Canadian Fundamental Index ETF (TSX: PXC).

PXC's big attraction is an MER of only 0.45% vs 0.71% for CRQ. There will be a little extra cost for PXC's trading and annual rebalancing that will only be known in a year but it should in the area of CRQ's 0.6% since it follows the identical index and trading rules as CRQ. That 0.2% lower fee will be money in my pocket - $20 extra for every $10,000 invested each and every year, which will compound and add up over the long term.

As I started to look more closely at PXC to assess its potential for my portfolio, it became apparent that I am not the only one who has been in the dark. Trading volumes are minuscule. Some days there have been no trades at all and on many days there have been less than a hundred shares traded. That has caused some misleading pricing reporting for PXC on mainstream sites like Google Finance, TMX Money and Morningstar, which all use Toronto Stock Exchange public data.

The public data makes it look as though PXC is doing a very poor job tracking its index and its Net Asset Value (NAV, the value of the underlying portfolio holdings within PXC). Look at this Morningstar chart of PXC's closing price vs that of CRQ. The lines don't overlap at all though they should track almost perfectly given that the two ETFs track exactly the same index with its holdings and weightings.
 
PXC also seems to be far off having its market price reflect its NAV per this Morningstar chart.


Meanwhile CRQ has been tracking its NAV very closely.

Making the situation even more puzzling is data published on the Invesco website in this table.

If we look closely at the data for May 4th, a day in which there is a large spread between PXC's price and NAV, we see that Google, Morningstar and TMX all report a closing price of $20.01. Invesco's table reports the price as $19.43, purportedly based on TSE data. The NAV was $19.45. It took a phone call to Invesco to clear up the discrepancy. According to Invesco, the reason is that most of the trading for PXC has actually been taking place on alternative exchanges like Alpha and the price there, which Invesco has been reporting, much more closely matches the NAV since it is much more current.

The important thing for the investor is that the bid-ask live quote for PXC at any point will be close to NAV. In that regard, I have minimal fear of paying a big premium over NAV for PXC. Unfortunately there is no way of actually verifying that since in Canada, unlike the USA where it is apparently required by regulation, the intra-day live NAV value is not available on any website. Yesterday, when I spoke to Invesco rep Chris, he checked and relayed to me that while the NAV at that moment was $19.00 the market bid price was $19.00 (what the bidder was offering to buy shares at) and the ask was $19.03. That's a very reasonable spread premium of only 0.16% for an investor placing a market order to buy. So the ETF pricing mechanism that keeps ETF prices and NAVs very close is not failing for PXC. Invesco says that there are six market makers for PXC, with the primary one being National Bank.

In short, PXC checks out ok. The 0.2% lower annual expense is worth the switch. Claymore or new owner BlackRock/iShares should have pre-emptively lowered CRQ's too-high fees. I am replacing CRQ with PXC in my test portfolio as well as my own holdings.

Monday, 30 April 2012

Disappointing News on Banking Ombudsman

Today, the Financial Post features an article about federal Finance Minister Jim Flaherty saying that he "will not force the country’s banks to resolve client disputes through the Ombudsman for Banking Services and Investments (OBSI) and is set to unveil new rules and regulations that will allow financial institutions to hire their own mediators to sort out disputes with clients."

Royal Bank and TD have used private mediation services for the last few years since opting out of OBSI. The world may not be falling dramatically apart because of this but it is and will be worse as made clear in the comparison table of OBSI vs TD and Royal's private mediator ADR Chambers, published today as it happens by Fair Canada. Harm by small individual abuses is harm nevertheless.  Blessing and encouraging the expansion of private dispute resolution will further tilt the scales in favour of the banks over consumers. As the hoary expression goes, "he who pays the piper calls the tune".

Sunday, 22 April 2012

UFile Giveaway Winners

The draw has been done. Congratulations to these three winners of the giveaway: IG, Aidan and Be'en. Please contact me via the "email me" link in the right hand sidebar and I will send you the code to enter to use UFile for free.

Wednesday, 18 April 2012

WaterFurnace Renewable Energy(WFI): 2011 YE Dilemma

Last month WFI published its annual report of 2011 results. For investors, the report along with the conference call (available on CNW), the annual information form (AIF) and the information circular paint a positive picture on some fronts offset by negatives on others and overall stagnation.

Competition from Natural Gas
When I made my original assessment of WFI 18 months ago, I concluded that the main constraint on the company's renewed growth was US housing starts and that when the US housing market recovered, sales and earnings growth would begin again. Not so certain, it now appears. The success of fracking and the resulting now plentiful natural gas supplies causing low gas prices are providing another big restraint on potential home geothermal heat pump installations. Consumers do the math and conclude that natural gas is cheaper, as the annual information form concedes: " ... very low natural gas prices will put competitive pressure on geothermal heat pumps if availability and low gas prices persist." That's probably why WFI said in the conference call that the residential market was down 9% in 2011.

That something else besides housing starts is affecting WFI's residential sales is seen in the fact that US starts did rise steadily through 2011, a condition about which management said the following in the Q1 report: "Housing starts are forecasted to be 600,000 by the end of 2011, despite the overhang of foreclosures and tighter bank lending practices. The residential replacement market will continue to be the single greatest opportunity for geothermal heat pump installations for the next several years. As residential new construction revives, then this will present a significant upside opportunity for the business." Housing starts reached 700,000 in December yet WFI experienced falling residential sales. The latest AIF still doesn't include natural gas prices amongst risk factors.

The discussion of the economics in the Wikipedia geothermal heat pump article tells us that the economies of scale on capital costs benefit commercial large buildings much more than residential, making systems more cost effective for commercial buildings, which is most likely why WFI's sales in that segment continue to grow.

WFI management says it is also looking more to international markets for growth - in the UK, China and South Korea - and also in the commercial sector. Maybe, but possible success is in the future and not evident now. The Hyper Engineering acquisition of 2011 in Australia is having no discernible effect except that shares issued for the purchase helped dilute earnings per share by 1 cent to $1.14.

Not-so-good Numbers in Financial Statements
Several 2011 numbers aren't good for investors, though not disastrously so.
1) Executive and employee compensation was way up - What justifies executive compensation rising 31% and employee salaries and benefits 13% (while employee headcount dropped from over 300 to 287) in 2011 given that company earnings and sales stagnated and the stock price dropped dramatically? The $1.7 million or so excess increase over what a 3% inflation rise would have been represents $0.14 cents less in earnings per share. Has the Board (whose rise in fees was only 2.6%) been paying attention? It is a dilemma to invest in a virtuous green company only to have management and employees grab an increasing share of the profits.
2) Warranty claim provisions rising faster than sales - Note 12 in the financial statements records another whopping increase (27%) in provisions for warranty claims, a big chunk of which is due to an increase in claim rates, as opposed to more units under warranty from higher sales. How this jives with an assumption stated earlier in the annual report that unit failure rates will remain the same as in the past is not explained ( I sent the company an email asking for an explanation and have not received a reply). Warranties have become a significant part of balance sheet liabilities and of cash flows (as a non-cash item added back). In the future if the reserves are correct or too low, when warranties are honoured/paid out, the warranty cash flow will reverse and become a drag on cash flow. There will be much less leeway to keep up dividends. If the reserves have been too high, earnings will get juiced by one-time upward adjustments. It is getting harder to understand how profitable WFI actually is.

In short, WFI has become much less attractive than before with its current sales geography and product mix, perhaps not to the point of selling, but management needs to deliver on expansion to new regions of the world and/or through new products.

Monday, 16 April 2012

UFile Tax Software Giveaway


Here's an opportunity for all the last minute tax filers to use UFile, one of the packages I rated highly recommended in my annual review last week. UFile has been one of the best packages ever since I started doing assessments several years ago.

Dr Tax, the makers of UFile, have supplied me with three codes for the online web version of UFile to give away to blog readers. With the code you can prepare your taxes for free, a value of $15.95 for an individual return, or $24.95 for a family (spouse and dependents).

This is how the giveaway works:
  • To enter submit a comment on this post below - though you don't have to, I'd be interested in your comments on tax prep software; use a unique name (Anonymous won't suffice!) so I can distinguish people
  • One entry per person please
  • Entries close Friday, April 20th midnight EST
  • I'll do a random draw of three (3) names from amongst the entries after the deadline
  • Winners will be announced on the blog and asked to contact me via email with their own email address so I can reply with the code to enter in the UFile software (your email will not be used for any other purpose than to contact you as a winner)
Best of luck and remember to file by the deadline of April 30th. UFile, like the other NETFILE certified packages, lets you do it online quickly and conveniently.

Thursday, 12 April 2012

Review and Ratings of Canadian Online Tax Software: 2011 Taxes Edition

Tax time again! For the 6th year running, these are my ratings and assessments of the best and the worst of the online tax preparation programs available to Canadian taxpayers for 2011 tax returns. As before, I've gone through all the packages certified by the Canada Revenue Agency for electronic submission of a return through NETFILE. The same ratings method has been used but the results are a bit different. Some packages are better, some just the same as last year, one is sadly worse and there's one new entrant.

Ratings Method: total score out of 45 max points on 5 factors
  1. Privacy and security (10 points) - How well does the online tax prep company protect your data and your privacy? What do they promise and what evidence is there of their capability to deliver? As I said last year, it is unfortunately still the case that this is the most uncertain area of the ratings - my numbers could be fairly wide of the mark - since it is hard to get much tangible proof of the reality vs the promises made, even compared to the minimal promises as are publicly made on the websites. Only one company (Acetax) actually claims to have been audited by an external party. CRA does not do anything, as they woefully admit in the disclaimer on the webpage with the list of packages, to check up on the companies and how they handle our data, which I think is shocking and unacceptable, given that a lot of people likely believe that NetFile certification somehow gives assurance of security protection.
  2. Flow, readability and layout (10 points) - How does the appearance and the flow of the program guide the taxpayer through all the steps, ensuring that everything is entered correctly in the right places? Is it easy to go back and forth, to review results and check one's work or make changes? The programs vary enormously on this factor, from simple on-screen versions of the paper forms, which merely do the arithmetic correctly and transfer amounts (or are supposed to!) between forms, to sophisticated interview processes akin to interaction with an accountant, asking questions to uncover all income and deductions and credits.
  3. Help (10 points) - How much access to explanations about tax rules is provided and how well placed is it? One of my on-going pet peeve test items is the infamous T1135 Foreign Income Verification Statement which a taxpayer with foreign property over $100,000 in cost must fill in, sign and send in to CRA. Does the program tell you, ideally at the point when you have to tick that box, that it is not required for foreign holdings within registered accounts like RRSPs? Some do not say so and others do not say that the T1135, if required, cannot be done online and that it must be submitted by mail on paper. Failure to send in a T1135 can be very painful.
  4. Responsiveness (5 points) - How fast is the online application at saving data and refreshing the screen? slow = frustration! Some of the programs are a lot more reliably responsive, an important factor if you are in the final throes of meeting the April 30th deadline.
  5. Accuracy (10 points) - How good a job does the program do at calculating your taxes and helping you legally pay the least amount? For those who think that NetFile certification means the programs will all come up with the same answer (as I believed myself before starting to look at all these packages a few years ago), it is time to recognize the reality. As I commented two years ago, CRA's certification only means the program is correctly including all the revenues. the programs differ enormously in their ability to automatically detect and claim all deductions and credits to which you are entitled. As a result, in my own case with all the packages my total income on line 150 was identical but balance owing on line 485 showed different amounts, anywhere from a few dollars to a few thousand dollars apart. In the cases where I had thousands less to pay this was the result of incorrect eligibility for deductions that the programs did not prevent. It is only because I used them all that I got to learn what should be the correct result. Some are much better than others at preventing incorrect input but it is always worth the time to use a couple of the programs to enter your data and compare the results. They all allow you to see the bottom line in much detail, if not actually to print or submit the completed return. The very best package (TaxChopper) at using deductions and credits for an individual and/or shared amongst family members is almost like having a skilled accountant doing your taxes - it is essentially an expert system for income tax. Three examples tested the packages' ability to optimize using age amounts and pension splitting, tuition and education transfers, foreign tax credits with inter-provincial residence thrown in for the trickiest rule. In no case did any other package beat TaxChopper - it always found deductions, transfers and credits to use and end up with the lowest taxes to pay. The difference was about $250 on a total refund of around $6000 for the fictional test family. Optimization can be very worthwhile.

Rankings:

Highly Recommended
#1 TaxChopper - 40 points - a repeat winner
"A tax expert system – Delivers on the biggest refund / lowest tax to pay promise. Best value for money."


#2 UFile - 38 points
"Polished, easy to use and handles all but the more sophisticated tax reduction optimizations"


Recommended
#3 H&R Block - 35 points
"Technically, it's UFile but it has a few less desirable privacy features"


#4 TurboTax - 33 points
"Guidance every step of the way with plenty of questions, reminders and some useful suggestions for future tax planning"


#5 EasyCTAX - 30 points
"Biggest improvement since last year's “beta version”. Now a credible product."


#6 AceTax - 29 points
"Just fine for those who need minimal help and are familiar with tax forms"


#7 (tie) WebTax4U - 26 points
"For those who know where things go and are familiar with tax forms"


#7 (tie) EachTax - 26 points
"Looks like the forms; for those who know what forms to use. Much improved responsiveness."


#9 Taxnic - 24 points
"OK package if you know what forms to fill and credits to claim. What CRA would give us if they created a NetFile package – no error checking or optimization, just the forms and correct transfer of amounts from box to box and form to form."


Merely OK
#10 MBOTax - 20 points
"It's like working with the paper forms except amounts get transferred automatically and arithmetic is done correctly."


#11 eTaxCanada - 19 points
"New interface a step backwards. Works ok if you know what you are doing and which forms to use"


Not Recommended
#12 - FileTaxOnline - 13 points
"Not recommended – too many weaknesses, some fatal"


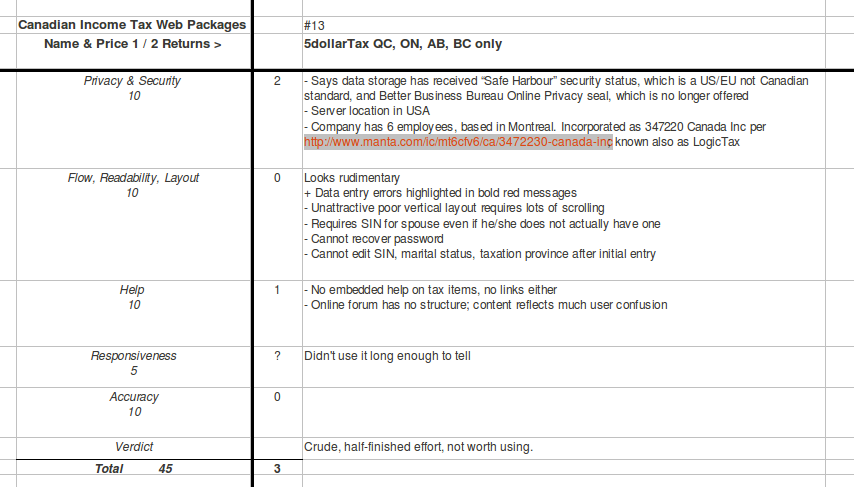
#13 5DollarTax - 3 points
"Crude, half-finished effort, not worth using."


#14 FASTnEASYTax - not rated
New this year. Doesn't support rental or self-employment income, or returns for Quebec, Yukon, Nunvaut, NWT

Wikinvest Wire

Economic Calendar


 Powered by Forex Pros - The Forex Trading Portal.